
Final Results of the Election
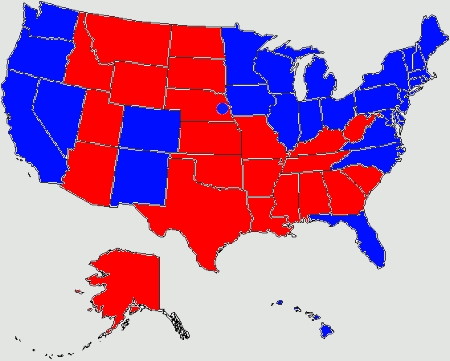
| Obama | McCain | |
| Electoral Votes | 365 | 173 |
Our Prediction
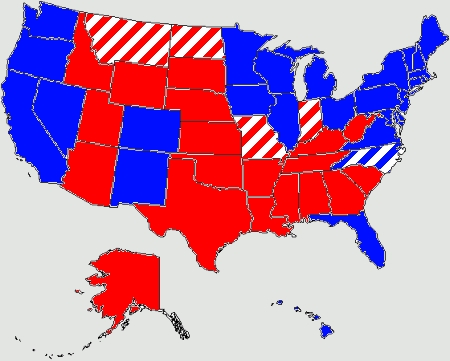
| Obama | McCain | |
| Probability of Winning | 1.00 | 0.00 |
| Probability of Getting 300 Electoral Votes | 1.00 | 0.00 |
| Expected Electoral Vote | 356.3 | 181.7 |
| Safe Electoral Votes* | 338 | 157 |
| Standard Deviation | 11.24 | |
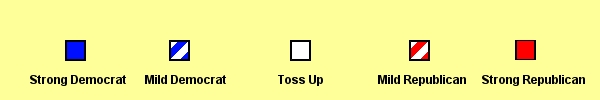
Our Closest Scenario
("Strong Democrat Swing")
| Obama | McCain | |
| Probability of Winning | 1.00 | 0.00 |
| Probability of Getting 300 Electoral Votes | 1.00 | 0.00 |
| Expected Electoral Vote | 362.0 | 176.0 |
| Safe Electoral Votes* | 338 | 157 |
| Standard Deviation | 10.97 | |
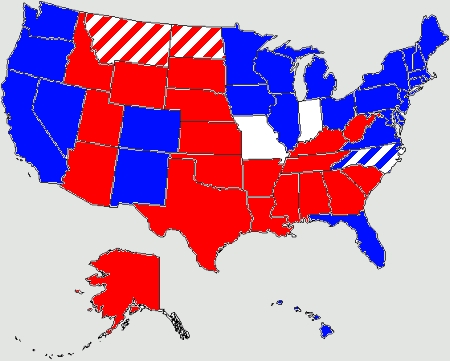
How Did We Do?
The 2008 United States Presidential Election is now history, and our nation has elected Senator Barack Obama as the 44th President of the United States.
Our model predicted 50 of the 51 states (including the District of Columbia). In the Neutral scenario, the expected number of Electoral College votes for President-Elect Obama was 356.3, while 365 were actually captured. This discrepancy corresponds to an error of 0.77 standard deviations (based on a standard deviation of 11.24). The Strong Democrat Swing scenario was the closest to the actual results, predicting 362 Electoral College votes.
All 40 of the so-called non-battleground states were predicted correctly. The remaining 11 battleground states are analyzed in the following table:
| State | Actual Obama Percentage of Votes | Actual McCain Percentage of Votes | Predicted Obama Probability of Winning | Predicted McCain Probability of Winning | Correct? |
| Colorado | 53% | 46% | 1.00 | 0.00 | Yes |
| Florida | 51% | 49% | 0.97 | 0.03 | Yes |
| Indiana | 50% | 49% | 0.27 | 0.73 | No |
| Missouri | 49% | 50% | 0.30 | 0.70 | Yes |
| Montana | 47% | 50% | 0.26 | 0.74 | Yes |
| Nevada | 55% | 43% | 1.00 | 0.00 | Yes |
| New Mexico | 57% | 42% | 1.00 | 0.00 | Yes |
| North Carolina | 50% | 49% | 0.71 | 0.29 | Yes |
| North Dakota | 45% | 53% | 0.25 | 0.75 | Yes |
| Ohio | 51% | 47% | 1.00 | 0.00 | Yes |
| Virginia | 52% | 47% | 1.00 | 0.00 | Yes |
All of these states, except Indiana, were correctly predicted. Of the five states with a 85% or lower probability of the leading candidate winning, four were correctly predicted. For the Strong Democrat Swing scenario, these five states are analyzed in the following table:
| State | Actual Obama Percentage of Votes | Actual McCain Percentage of Votes | Predicted Obama Probability of Winning | Predicted McCain Probability of Winning | Correct? |
| Indiana | 50% | 49% | 0.43 | 0.57 | No |
| Missouri | 49% | 50% | 0.41 | 0.59 | Yes |
| Montana | 47% | 50% | 0.39 | 0.61 | Yes |
| North Carolina | 50% | 49% | 0.80 | 0.20 | Yes |
| North Dakota | 45% | 53% | 0.31 | 0.69 | Yes |
From these results, Indiana was the most difficult state to predict, closely followed by Missouri.
Thank you for visiting our web site. Look for Roll... to the White House in 2012!
